

Most products are built for a user with perfect vision, full motor control, and no cognitive load. That assumption leaves a lot of people out. Roughly 1 in 4 adults in the US, EU, and UK live with a disability. That rate has grown over the past two decades and shows no sign of stopping.
PLUS QA compiled our 2026 Disability Statistics Guide by pulling current figures from official government and agency sources across all three regions. The numbers describe an audience that shifts significantly from state to state and country to country, particularly within a single enforcement region.
How 2026 Disability Statistics Change Testing Assumptions
Accessibility extends far beyond screen reader use. Mobility, cognition, stamina, memory, vision, and hearing are all common conditions — and they often overlap within the same user population.
Some users need more time to complete tasks. Others rely on consistent navigation patterns or struggle with precise pointer movement. A checkout flow that works in testing can fail for users who need more time to read. A form can validate correctly and still become confusing when instructions require sustained attention.
The data in this guide shows where those conditions concentrate, helping teams turn disability statistics into testing decisions.
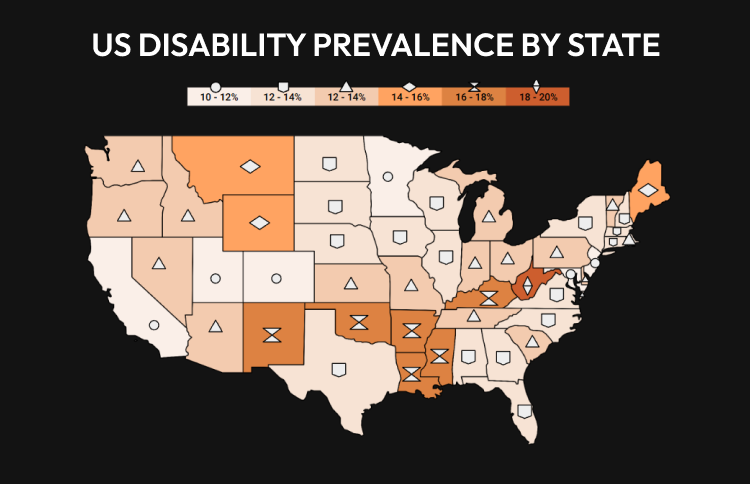
US Disability Statistics: A Nation of Uneven Needs
The US Census Bureau estimates that 45.8 million Americans have a disability. What that number doesn't show is how much rates vary by state — from around 10% in some states to nearly 20% in others. The same features may work smoothly in some states and create barriers in others. The guide's regional breakdown shows what those differences mean for teams releasing software across multiple states.
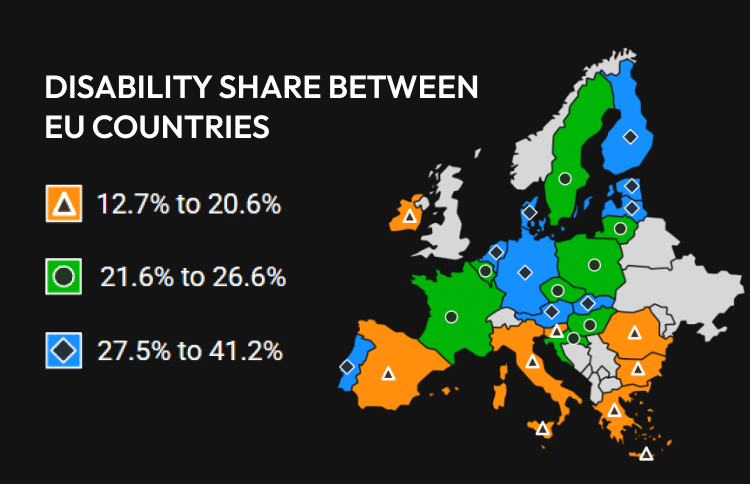
EU Disability Statistics: One Law, Many Audiences
In the European Union, 90 million people have some form of disability — up from 87 million in 2023. Under the same European Accessibility Act requirements, country-level prevalence ranges from 12.7% in Bulgaria to 41.2% in Latvia. The same product can encounter dramatically different user populations across member states without any code change. The full breakdown shows who will be the first to run into problems.
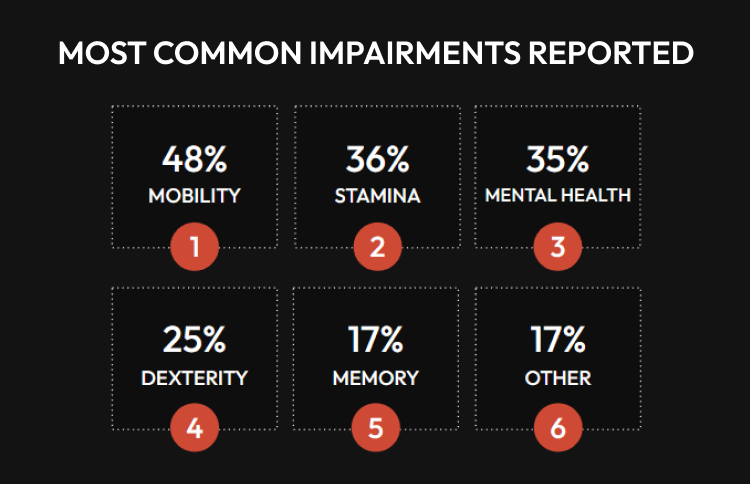
UK Disability Statistics: Rising Numbers, Regional Gaps
In the UK, 16.8 million people have a disability, a number that has climbed steadily since 2002. Within a single national system, regional differences are significant. The most common impairments aren’t the ones teams usually test first. Mobility, stamina, and mental health conditions rank higher than vision or hearing. The full guide breaks down UK prevalence by nation, region, and impairment type. The numbers are likely to change how teams prioritize testing.
How Disability Statistics Should Shape Your Testing Strategy
Accessibility issues increasingly resemble performance issues. They appear after release, when people act in ways test environments don’t simulate. Teams that start early spend less and ship better products.
This guide brings together official data from the United States, European Union, and United Kingdom into a single reference point. It shows how the operating conditions around software continue to shift and what that means when the people using a product don't match the people it was built for. The regional breakdowns show where problems are most likely to appear first.
Read the 2026 Disability Statistics Guide to see the full datasets and where those patterns are most likely to affect your products.