

The Influence of User Behavior on Mobile App Testing
You can plan an app down to the pixel. You can map every flow, refine every interaction, and ship a feature set that works exactly as you intended. There’s one thing you can’t plan for: people.
People are unpredictable. Some skip updates for weeks because their phone feels fine as it is. Others install new versions the moment they appear. And a surprising number hold onto devices so old they don’t receive updates anymore. That unpredictability creates small gaps that show up in ways you wouldn’t think to check.
The good news is that their unpredictability is predictable once you know what to look for. QA professionals see these gaps developing long before they turn into problems for your user. We do that by digging through data that tells us which OS versions people hold onto, which devices dominate real-world usage, and which upgrade patterns shape the months ahead.
Once we understand these patterns, we can build a testing strategy that adapts to user unpredictability. Here are the latest iOS and Android statistics heading into 2026 that will help you understand your users’ behavior patterns and protect them from the gaps they unknowingly create.
Mobile OS Distribution in 2026 and Why It Matters for Testing
When you're building a testing strategy, the OS distribution gives teams a quick sense of the environments they’ll need to cover.
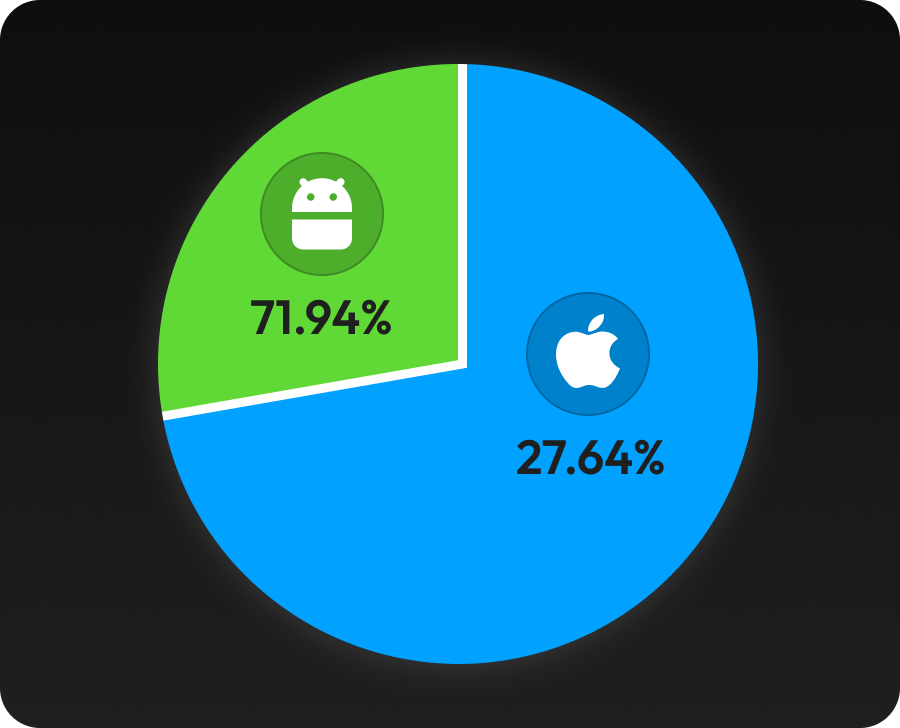
Worldwide
- Android: 71.94%
- iOS: 27.64%
United States
- iOS: 57.56%
- Android: 42.01%

This contrast shapes how teams plan their coverage. A global audience often requires broader Android support because of more manufacturers, performance levels, and upgrade timelines. A U.S. audience leans toward iOS, where adoption moves quickly and most users gather around the newest releases. Keeping both views in focus helps teams build a testing plan that reflects the platforms people rely on every day.

iOS Market Share in 2026 and What It Means for Testing
iOS can seem easy to plan for, but the way people use it creates more variation than teams expect. Different OS versions, device types, and regional adoption patterns can all influence how smooth and reliable your app feels to users. Understanding the 2026 iOS version distribution helps teams see where most users spend their time and how small differences between builds can influence performance and layout.
Official adoption numbers
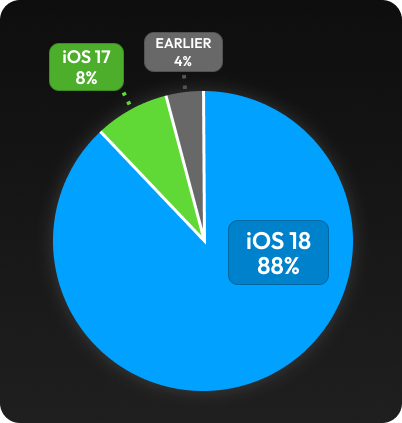
Apple’s most recent public update (June 4, 2025) shows strong adoption across devices:
- iOS 18 runs on 88% of iPhones introduced in the past four years and 82% of all active iPhones.
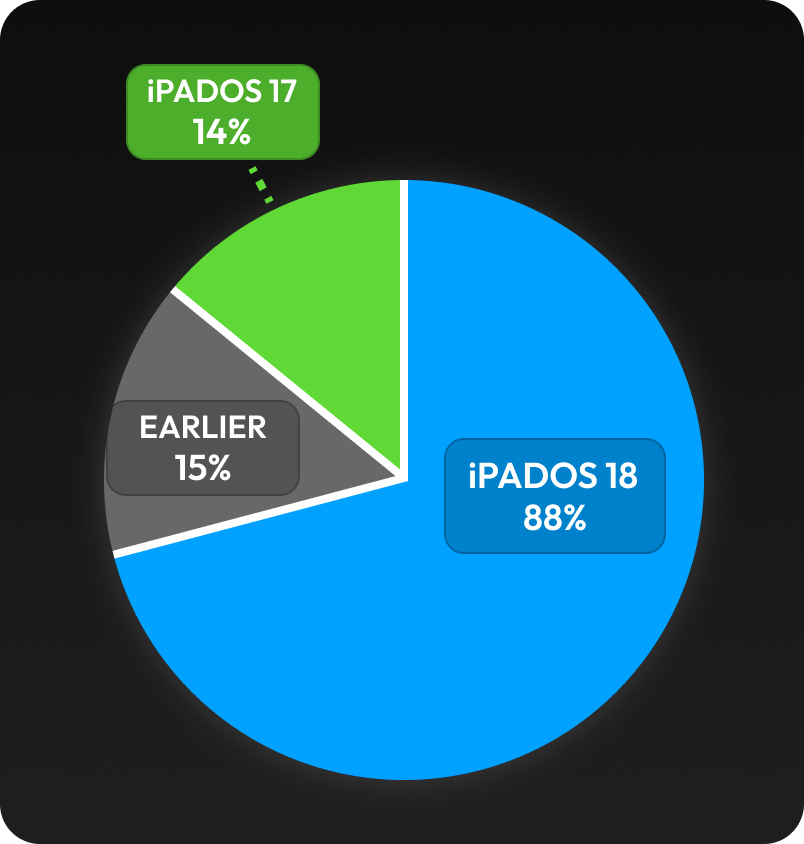
- iPadOS 18 runs on 81% of iPads introduced in the past four years and 71% of all active iPads.
These numbers confirm that iOS users adopt new versions quickly. Still, several older iOS versions remain in use and can affect performance, layout, and compatibility.
iOS Version Distribution
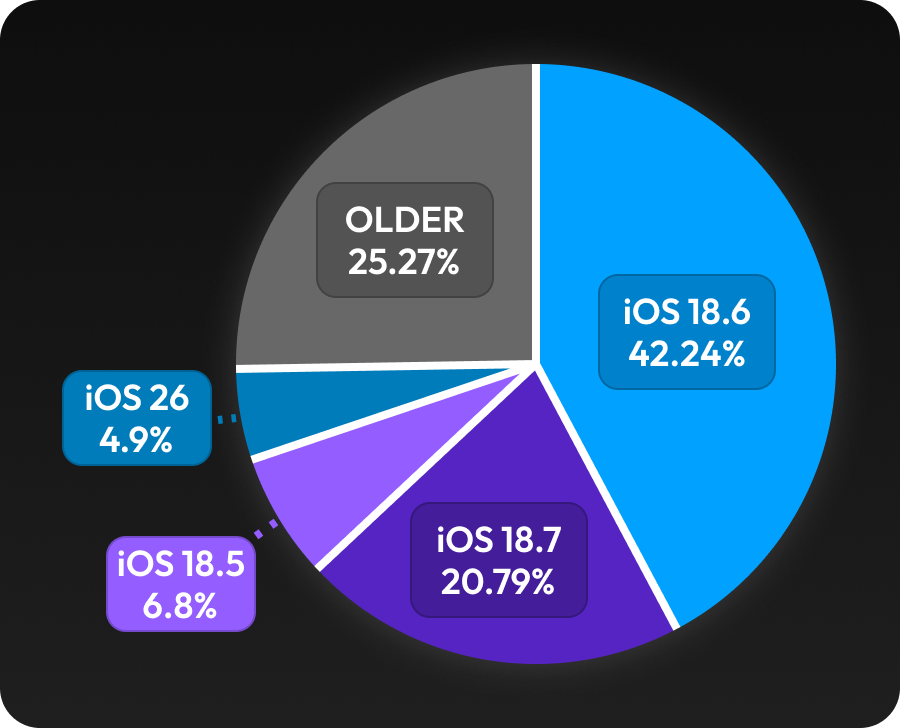
Statcounter’s Worldwide usage data (November 2025) shows how individual builds break down:
- iOS 18.6: 42.24%
- iOS 18.7: 20.79%
- iOS 18.5: 6.8%
- iOS 26.0: 4.9%
- Older iOS versions: 25.27%
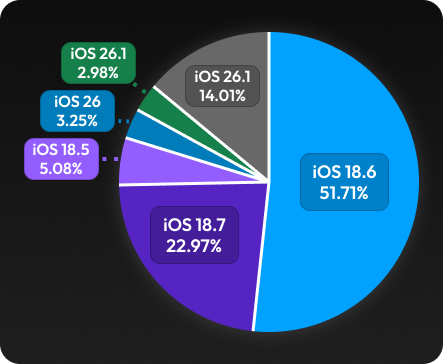
The usage data for the United States (November 2025) leans even more heavily toward the latest versions:
- iOS 18.6: 51.71%
- iOS 18.7: 22.97%
- iOS 18.5: 5.08%
- iOS 26.0: 3.25%
- iOS 26.1: 2.98%
- Older iOS versions: 14.01%
What the two regions tell us
The numbers show that iOS users upgrade fast, but the long tail still matters — especially outside the U.S. QA teams need to focus on the newest iOS 18 builds because many users quickly adopt, while keeping at least one earlier generation in testing since those users stick around longer than expected. Fast upgrade cycles also mean those subtle differences between iOS 18 point releases can reveal layout or permission quirks that only become obvious once more people land on the newest version.
iPads also deserve a quick look in this year’s numbers. With 71% of iPads now running iPadOS 18, tablet adoption has moved forward almost as quickly as iPhone adoption — and tablets tend to stay in circulation longer. For teams supporting tablet workflows, this means layout testing, multitasking behavior, and keyboard-based interactions often find issues you won’t catch on phones alone.
Explore our 2025 iOS Device Testing Guide for year-over-year context.
Android Market Share in 2026 and How It Affects Your Testing Strategy
Android remains the majority mobile OS worldwide. Its diversity is both a strength and a challenge. With dozens of manufacturers and long device life cycles, fragmentation continues to influence app behavior. Understanding how Android versions are distributed in 2026 helps teams see which Android versions their users rely on — and where differences in performance or compatibility are most likely to appear.

Android version distribution
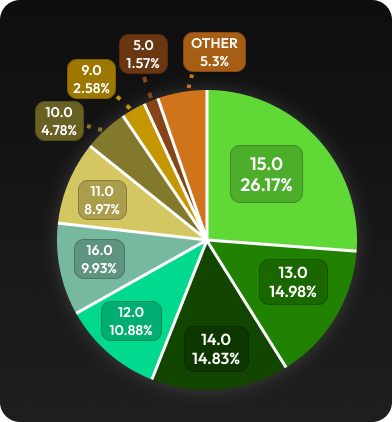
Statcounter’s Worldwide Android usage data (November 2025) shows why Android testing must span several OS generations:
- Android 15.0: 26.17%
- Android 13.0: 14.98%
- Android 14.0: 14.83%
- Android 12.0: 10.88%
- Android 16.0: 9.93%
- Android 11.0: 8.97%
- Android 10.0: 4.78%
- Android 9.0 (Pie): 2.58%
- Android 5.0 (Lollipop): 1.57%
- Other: 5.3%
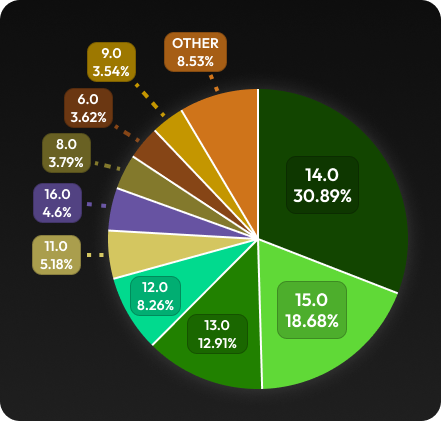
The usage data for the United States (November 2025) follows the same broad pattern but skews slightly newer:
- Android 14.0: 30.89%
- Android 15.0: 18.68%
- Android 13.0: 12.91%
- Android 12.0: 8.26%
- Android 11.0: 5.18%
- Android 16.0: 4.6%
- Android 8.0 (Oreo): 3.79%
- Android 6.0 (Marshmallow): 3.62%
- Android 9.0 (Pie): 3.54%
- Other: 8.53%
What the two regions tell us
The worldwide numbers show a wide spread of active Android generations, which is what most global products must plan for. In the U.S., traffic concentrates more heavily around Android 14 and 15, but older versions don’t disappear — they just shrink into smaller but sizable pockets. These datasets show us that Android never collapses into a single dominant version. Users are scattered across several OS generations, and that spread directly shapes performance, layout behavior, and compatibility issues.
Android tablets aren’t a major slice of traffic, but they do introduce a few extra screen sizes and aspect ratios you’ll want to cover if your analytics show that people are using them.
Explore our 2025 Android Device Testing Guide for year-over-year context.
The Devices People Use and Why They Matter for Testing
Even with OS version coverage in place, hardware can still influence real-world performance. A smooth animation on a high-end device can stutter on a mid-range one. A layout that works on a premium display can shift or compress on smaller or older devices. Understanding which devices people buy helps teams build testing that matches everyday use, and the 2025–2026 sales data makes those patterns clear.
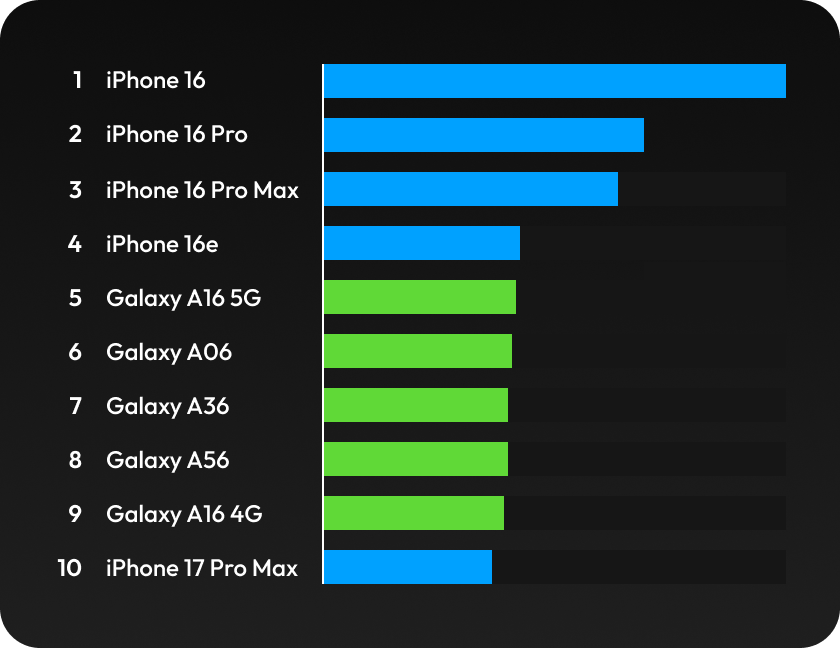
Top-selling smartphones
Counterpoint Research’s Q3 2025 global rankings show Apple and Samsung continuing their familiar pattern:
- iPhone 16 (best-selling overall)
- iPhone 16 Pro
- iPhone 16 Pro Max
- iPhone 16e
- Samsung Galaxy A16 5G
- Samsung Galaxy A06
- Samsung Galaxy A36
- Samsung Galaxy A56
- Samsung Galaxy A16 4G
- iPhone 17 Pro Max
This sales data offers two important reminders:
- iPhones drive the premium market.
- Samsung’s mid-range devices drive the volume market.
Both influence how your app performs across different hardware profiles. These device trends also shape how teams choose which models belong in a realistic mobile testing plan.
What’s Different in Mobile Usage Since 2025
Last year’s iOS and Android testing guides showed how quickly mobile behavior can shift, and the 2026 data pushes those trends further. iOS adoption moved forward fast, with most users now running the latest minor versions of iOS 18, while older iPhones from the 12–14 era continue to appear in analytics more than many teams expect. On Android, the number of active OS generations widened, and mid-range Samsung A-series devices strengthened their role as top sellers worldwide.
Two trends stand out when you compare 2025 to 2026.
- iOS users upgrade more quickly than ever.
- Android users remain spread across several OS versions and performance levels.
Foldables sales skyrocketed overseas in 2025. According to IDC and Counterpoint’s regional reports, foldable shipments grew more than 40% year-over-year in South Korea. China now accounts for half of all global foldable sales. That growth is still concentrated in a few markets, yet it’s strong enough to introduce new screen and layout behaviors that some apps will encounter.
These shifts are why the 2026 recommendations look different from last year’s device lists. They set a clear foundation for the coverage priorities teams should build into their 2026 plans.
Turning OS and Device Data Into a Smarter 2026 Testing Plan
Once you understand the mix of devices and OS versions your users rely on, a testing plan becomes much easier to shape. OS adoption, device popularity, and upgrade habits give you a good sense of where issues tend to appear. When you connect those patterns to your coverage decisions, you build a testing strategy that stays aligned with how people use your product.
iOS recommendations
A 2026 iOS testing plan includes:
- The latest iOS 18 minor versions
- iOS 17 for users who update more slowly
- iPadOS 18 plus one earlier iPadOS version for teams supporting tablets
- Early iOS 26 versions as adoption expands
Android recommendations
Android’s broader version diversity means coverage should include:
- Android 16 and Android 15 as primary testing targets
- The two earlier versions with the strongest global share (13 and 14)
- One older supported version (11 or 12) selected based on your analytics or top markets
Device recommendations
A well-rounded 2026 device lineup mirrors the hardware patterns we see most often in analytics. Our recommended devices include:
- A current iPhone flagship
- Two older iPhones (one recent model, one several years old, reflecting long iPhone life cycles)
- A current Samsung A-series mid-range device
- A budget Android model to capture lower-performance hardware
- A Google Pixel model to represent clean Android builds
- An optional foldable, with adoption rising in markets like South Korea and China (per Counterpoint and IDC regional reports)
- A current iPad or Android tablet if your product supports tablet workflows
What This Means for Testing
This lineup reflects 2025–2026 usage trends, where premium iPhones, mid-range Samsung A-series devices, Pixels, and budget Androids make up the majority of active traffic, and foldables continue to expand in key regions. Once these OS and device targets are set, your testing starts to match the conditions your users experience every day — and creates a strong foundation for a stable, reliable release.
Because OS adoption and device patterns evolve quickly, most teams revisit their coverage at least a few times a year. Staying current with those shifts helps you catch issues that only emerge as users move to newer versions and newer hardware.
For products that see consistent tablet traffic, including at least one iPad or Android tablet in the testing matrix helps catch layout and workflow differences that don’t appear on phones.
Building a Testing Approach That Fits How People Use Their Devices
You can’t predict every device, OS version, or upgrade decision your users will make. You can understand the patterns behind those choices and use them to build a smarter testing strategy.
The 2026 iOS and Android statistics show users spread across operating systems, including recent iOS releases, a spread of Android versions, and a mix of premium and mid-range devices that stay in use for years. When your test plans follow those patterns instead of assumptions, the gaps that used to surprise you become much easier to manage.
At PLUS QA, we track OS and device trends as they form. We pair that insight with an extensive physical device library that spans current flagships, older iPhones, and a wide range of mid-range and budget Android phones, so your app is tested on the same devices as all of your users.
A strong testing plan grows from this kind of data. It helps protect your users from the gaps they unknowingly create and supports the kind of stable, reliable experience that keeps them coming back. If you need help shaping a 2026 testing plan that accounts for the unpredictability of people, contact our team. We’ll be happy to walk you through the data and help you build a custom plan.