
QA Testing

Top Web Browsers for Testing in 2026

Posted on 

A release is approaching. There’s one problem, though. Your QA team has more possible test environments than time. Poor prioritization can leave common browser combinations untested while the team spends hours on environments used by few customers. Compatibility defects can still reach production after a packed testing schedule.

Understanding worldwide market share gives teams a clear starting point. It shows which operating systems and browsers account for the most global web traffic, while desktop, mobile, and tablet data reveal how those priorities change by device. Teams can use that context to build an initial coverage plan before refining it with their own product analytics.

Customer data shows where an audience differs from worldwide usage patterns. Differences in browser engines, API support, performance, accessibility behavior, and platform-specific features create the need for coverage beyond the market leader. Industry, geography, device mix, and product risk then help determine how broad that coverage should be. Together, those factors give teams a clearer way to decide which browsers deserve full coverage, which need targeted testing, and where limited QA time will do the most good.

Worldwide Operating System Market Share

Why Operating Systems Matter

Browser adoption is closely tied to the operating systems people use. Chrome’s reach is connected to Android and Google’s broader mobile ecosystem, Safari comes built into Apple devices, and Microsoft Edge is integrated with Windows. Operating systems also influence hardware, software updates, enterprise policies, input methods, and which browser-and-device combinations customers encounter.

Looking at operating systems first gives browser market share more context. A browser with a strong mobile audience may require different devices and test cases than one concentrated on corporate Windows computers. OS data helps teams understand where browser usage comes from before deciding which environments deserve the most attention.
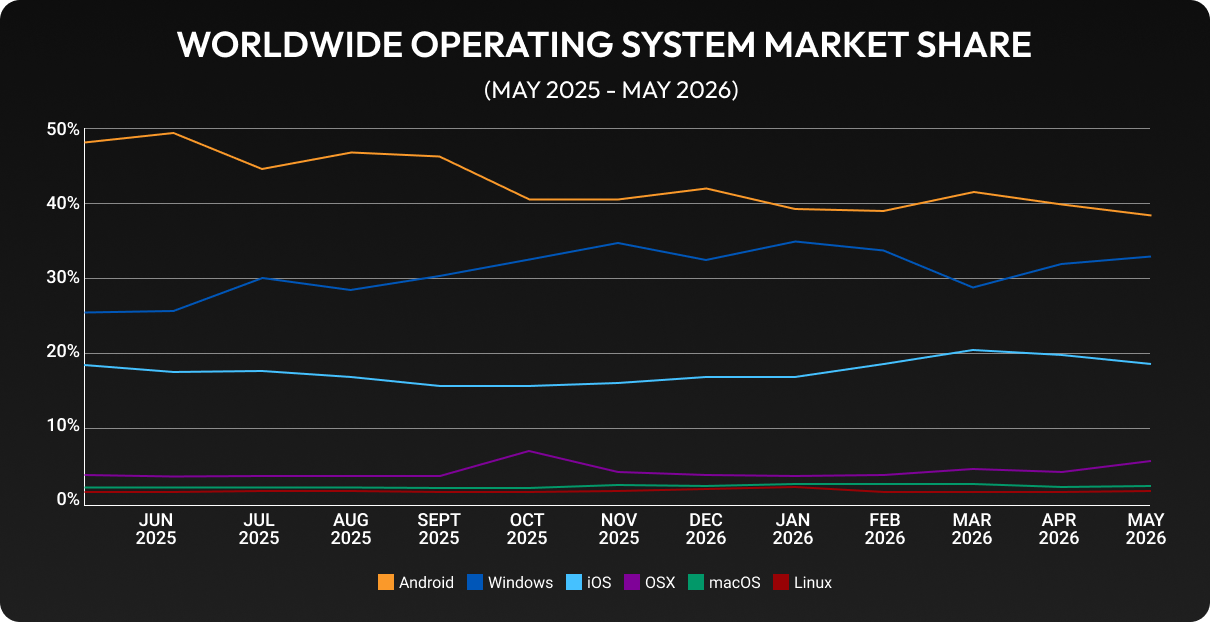
Worldwide Operating System Market Share (2026)

Statscounter.com graph for OS market share worldwide
Source: Statscounter.com

StatCounter’s May 2026 data places Android first with 34.90% of worldwide traffic, followed by Windows at 29.93% and iOS at 16.82%. The Unknown category accounts for 9.05%. StatCounter reports OS X at 5.06% and macOS at 2.03%, giving Apple desktop systems a combined share of 7.09%.

Over the 12-month period, Android declined 11.77 percentage points, Windows gained 5.16 points, and iOS decreased 0.98 points. Apple’s two desktop categories rose from a combined 5.55% to 7.09%.

Android’s sharp decline happened alongside a similarly striking rise in traffic StatCounter could not assign to an operating system. StatCounter relies on user-agent information to identify operating systems, while modern browsers increasingly limit the device and platform details those strings provide. Unusual or obscured user agents, bot traffic, privacy tools, in-app browsers, and changes to StatCounter’s detection rules could also affect classification. StatCounter has not identified the cause of this specific increase, so the annual shifts should be read with caution rather than treated as a clear migration from Android to another platform.

Key Takeaways

  • Android remains the largest operating system worldwide. Its 34.90% share keeps Chrome on Android among the highest-priority environments for consumer websites and web applications. Teams should validate major workflows across representative Android devices, versions, screen sizes, and hardware tiers.
  • Windows continues to anchor desktop testing. Its 29.93% share reinforces the importance of Chrome and Edge on Windows. Enterprise applications, internal tools, and B2B platforms may see Windows usage well above the worldwide average.
  • iOS keeps Safari central to mobile coverage. Its 16.82% share represents a substantial audience across iPhones and iPads. Responsive layouts, touch interactions, forms, authentication, media, checkout, and account workflows should all be validated on Apple mobile devices.
  • Apple desktop usage is larger than either StatCounter label suggests alone. OS X and macOS combine for 7.09% of worldwide traffic. Teams should use the combined figure when evaluating Mac coverage rather than treating the 2.03% macOS category as Apple’s full desktop share.

Worldwide Browser Market Share

Browser Market Share Overview

Browser market share helps QA teams prioritize the environments where compatibility defects could affect the most users. Testing every browser, version, operating system, and device combination would consume resources most teams need elsewhere, so worldwide usage offers a practical starting point.

Worldwide figures establish an initial testing order. Teams should adjust each browser’s priority based on customer analytics, geography, industry requirements, and product risk. A browser with modest global usage may account for a meaningful share of a product’s customers or support a workflow where failure carries greater consequences.

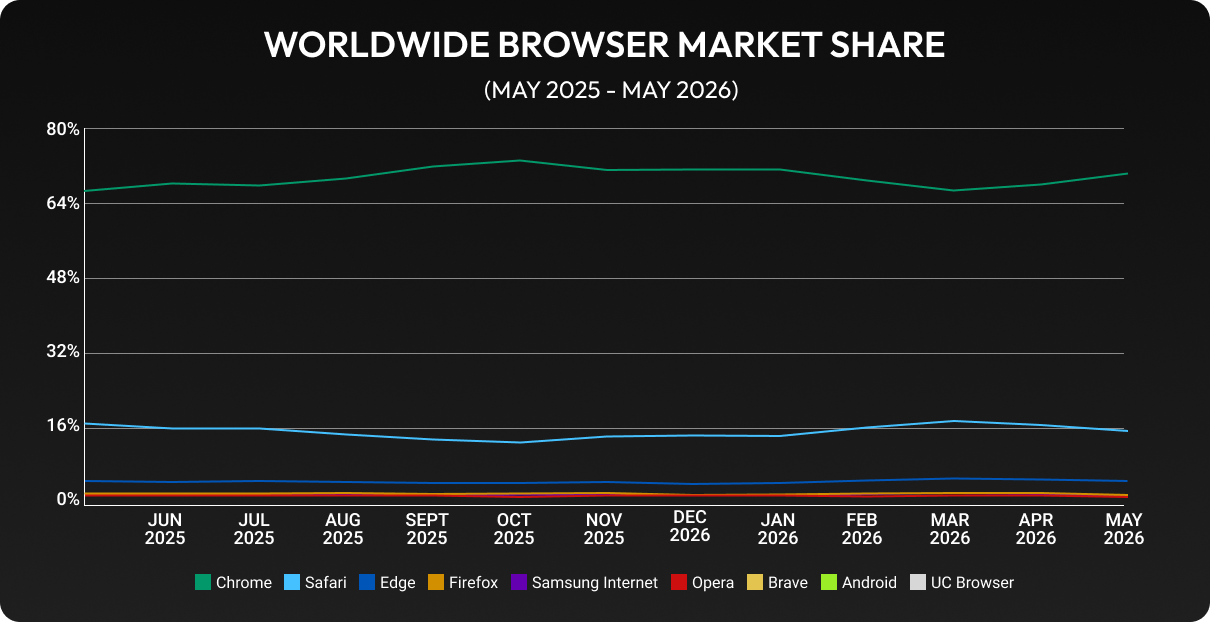
Worldwide Browser Market Share (2026)
Statscounter.com graph for browser usage on all platforms
Source: Statscounter.com

Chrome accounted for 70.30% of worldwide browser usage in May 2026, placing it far ahead of Safari at 15.71% and Edge at 5.10%. Firefox held 2.19%, Samsung Browser 1.89%, and Opera 1.78%. Brave, UC Browser, Android Browser, and every remaining browser each held less than 1%.

Chrome gained 3.45 percentage points from May 2025 to May 2026. Safari declined 1.48 percentage points, while Edge remained nearly level with a decrease of 0.11 points. Firefox, Samsung Browser, and Opera recorded smaller declines.

Chrome’s share fluctuated during the year rather than rising steadily. It reached 73.17% in October 2025, fell to 66.70% in March 2026, and recovered to 70.30% in May. StatCounter has not published an explanation for those monthly swings, so the year-over-year change provides the clearest comparison.

Browser Analysis

Google Chrome

Chrome’s 70.30% worldwide share makes it the primary testing environment for nearly every public-facing website and web application. Its audience spans desktop and mobile devices, and its 3.45-point annual gain widened an already substantial lead.

Teams should test current Chrome releases across desktop and Android devices, common screen sizes, responsive layouts, and critical customer workflows. Chrome and other Chromium browsers use Blink, so Chrome coverage cannot confirm compatibility with WebKit or Gecko.

Safari

Safari held 15.71% of worldwide usage, supported by Apple's installed base across iPhone, iPad, and Mac devices. Its share declined from 17.19% in May 2025, though it remains the clear second-place browser worldwide.

Safari uses WebKit, which can produce different results from Chromium browsers in CSS, forms, media, browser APIs, touch interactions, and responsive layouts. Apple permits qualifying alternative browser engines in the European Union and Japan, though Safari remains WebKit-based and continues to require dedicated testing. If non-WebKit browsers reach iPhones at scale, iOS coverage will become broader rather than simpler.

Microsoft Edge

Edge accounted for 5.10% of worldwide usage, nearly even with its 5.21% share a year earlier. Its global position may understate its importance for enterprise software, internal applications, and organizations built around Microsoft products.

Edge is based on Chromium, giving it substantial compatibility with Chrome. Separate testing can still uncover differences involving enterprise policies, identity services, security controls, default settings, release timing, and Microsoft integrations. Windows-focused B2B products should include Edge as a dedicated environment rather than treating Chrome results as a complete substitute.

Mozilla Firefox

Firefox represented 2.19% of worldwide browser usage, down from 2.39% the previous year. Its audience is much smaller than Chrome’s or Safari’s, but Firefox remains technically important because it uses Mozilla’s Gecko engine.

Testing Firefox expands coverage beyond Blink and WebKit. It can uncover differences in CSS, JavaScript, browser APIs, accessibility behavior, and standards implementation that Chromium and Safari testing may miss. Products serving developers or other audiences with above-average Firefox usage may need broader coverage than the worldwide figure suggests.

Samsung Browser

Samsung Browser accounted for 1.89% of worldwide traffic, down from 2.12% in May 2025. Samsung renamed the browser in March 2026, though StatCounter still reports it under the original label, Samsung Internet. Its global share is modest, but the browser remains relevant within the Android market because it is available across Samsung’s large mobile-device base.

Samsung Browser is Chromium-based, yet browser versions, device hardware, Samsung-specific features, and Android fragmentation can affect performance and behavior. Consumer services with substantial Samsung traffic should consider it for secondary coverage.

Opera

Opera held 1.78% of worldwide traffic, compared with 1.91% a year earlier. It uses Chromium, which reduces some compatibility risk for products already tested thoroughly in Chrome.

Routine Opera coverage may be limited for organizations with constrained resources. It becomes more relevant when customer or country-level analytics show a meaningful audience.

Other Browsers

Brave remained nearly flat at 0.84%. UC Browser declined from 0.80% to 0.56%, while Android Browser fell from 1.01% to 0.51%.

UC Browser is a current mobile browser developed by Alibaba-owned UCWeb and may warrant coverage in countries or customer groups where its usage exceeds the worldwide average. Android Browser generally refers to Android’s legacy built-in browser, though StatCounter does not explain exactly which traffic falls under that label.

These browsers generally do not require the same testing depth as Chrome, Safari, Edge, or Firefox for a broad worldwide audience. Teams should add them when product analytics, regional usage, contractual requirements, or customer demographics provide a clear reason.

Browser Usage by Device Type

Browser market share changes by device, even when the overall leader stays the same. Chrome ranks first on desktop, mobile, and tablet. Edge is much stronger on desktop. Safari holds a much larger share on iPhones and iPads. Android Browser remains unusually prominent on tablets. Separating the data by device helps teams choose the browser-and-platform combinations that deserve testing instead of applying one worldwide ranking to every environment.

Desktop Browser Market Share
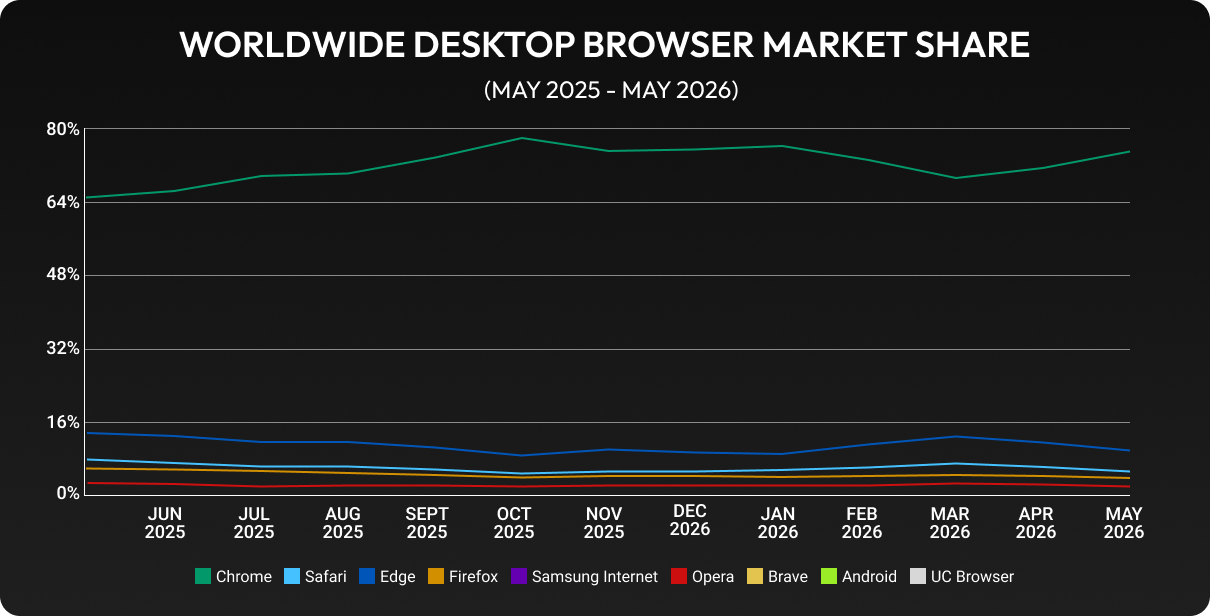
Statscounter.com graph for browser usage on desktop
Source: Statscounter.com

Chrome accounted for 75.05% of worldwide desktop browser usage in May 2026. Edge followed at 9.85%, with Safari at 5.31%, Firefox at 3.79%, Opera at 1.97%, Samsung Browser at 1.33%, and Brave at 1.24%.

From May 2025 to May 2026, Chrome gained 9.88 percentage points. Edge declined 3.79 points, Safari fell 2.60 points, Firefox dropped 2.09 points, and Opera decreased 0.78 points. Chrome’s share moved substantially during the year, reaching 78.14% in October 2025 and falling to 69.37% in March before finishing at 75.05%.

Samsung Browser appeared in StatCounter's desktop data only at the end of the period, reaching 1.07% in April and 1.33% in May, following the browser's stable release on Windows in March 2026. That's a large share for a new desktop entrant and too little history for a year-over-year comparison, so treat it as one to watch rather than one to plan around.

Key Takeaways

  • Chrome dominates worldwide desktop browsing. Its 75.05% share makes it an essential test environment on Windows and macOS. Product analytics should determine how deeply each operating system is covered.
  • Edge remains the second-largest desktop browser. Its worldwide share fell from 13.64% to 9.85%, though it may account for a much larger portion of traffic within companies that standardize on Windows and Microsoft services.
  • Safari represents a smaller global desktop audience. Its share declined from 7.91% to 5.31%. Products serving Mac-heavy audiences may require broader Safari coverage than the global desktop figure suggests.
  • Firefox justifies targeted desktop coverage. Its share fell from 5.88% to 3.79%, though testing Firefox can uncover layout, JavaScript, and accessibility differences that may not appear in Chrome, Edge, or Safari. Teams should expand Firefox coverage when product analytics show usage above its 3.79% global desktop share.
  • Opera remains a lower priority for broad worldwide audiences. Its share declined from 2.75% to 1.97%. Customer analytics and regional usage should determine whether it receives more than basic testing.
  • Samsung Browser is a new desktop consideration. Add the Windows version to recurring coverage when it appears in customer analytics, falls within the product’s support policy, or is required by a customer account. Otherwise, monitor adoption before assigning it dedicated regression testing.

Desktop Testing Recommendations

  • Primary browser coverage: Test Chrome and Edge on Windows, Safari on macOS, and Firefox on at least one major desktop operating system. Weight Edge more heavily in managed Windows environments that rely on Microsoft identity services, browser policies, or device management.
  • Platform-specific considerations: Validate keyboard navigation, window resizing, multiple tabs, file uploads and downloads, print layouts, extensions, and behavior under enterprise security software.
  • When to expand coverage: Add older browser versions, Opera, Brave, Samsung Browser, or other secondary browsers when customer analytics, contractual requirements, regional usage, or support policies justify them.

Mobile Browser Market Share
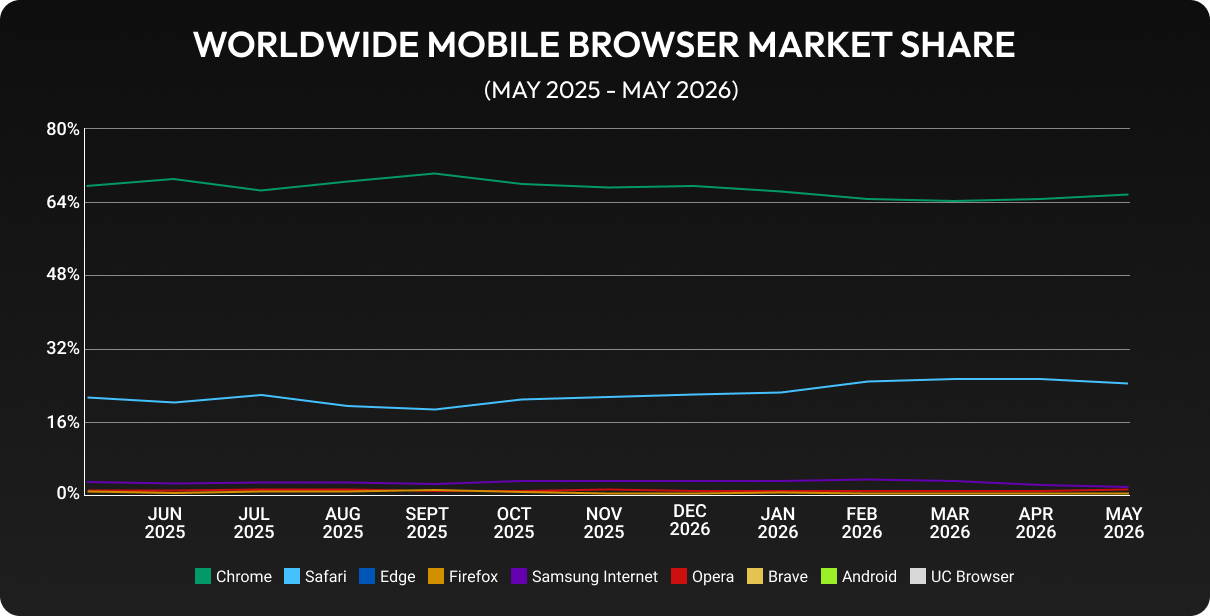
Statscounter.com graph for browser usage on mobile
Source: Statscounter.com

Chrome led worldwide mobile browser usage with 66.40% in May 2026. Safari held 25.25%, leaving the two browsers with a combined 91.65% of the mobile market. Samsung Browser ranked third at 2.44%, followed by Opera at 1.62% and UC Browser at 1.11%.

Chrome declined 1.91 percentage points from May 2025, while Safari gained 3.22 points. Samsung Browser dropped 0.92 points, the category labeled Android Browser lost 0.57 points, and Firefox gained 0.23 points.

Key Takeaways

  • Chrome remains the primary Android browser. Its 66.40% worldwide share makes Chrome on Android a required testing environment for most consumer-facing websites and web applications. Coverage should include representative screen sizes, hardware tiers, Android versions, and network conditions.
  • Safari accounts for one-quarter of mobile traffic. Its share rose from 22.03% to 25.25%, reinforcing the importance of testing on iPhone hardware.
  • Samsung Browser remains the largest mobile browser behind Chrome and Safari. Unlike on desktop, the browser has been available on Android phones and tablets for years. Products with substantial Samsung traffic may see considerably higher usage than its 2.44% worldwide share suggests.
  • Android Browser continues to decline. Its reported share dropped from 1.16% to 0.59%, supporting limited coverage for most organizations unless their analytics show continued use.
  • Smaller browsers remain audience-dependent. Opera increased slightly to 1.62%, while UC Browser fell to 1.11%. Firefox and Edge remained below 1%.

Mobile Testing Recommendations

  • Primary browser coverage: Test Chrome on representative Android devices and Safari on current iPhones, along with at least one older supported device or operating-system version.
  • Platform-specific considerations: Validate touch input, virtual keyboards, orientation changes, forms, authentication, media, permissions, navigation, and performance under mobile network conditions.
  • When to expand coverage: Add Samsung Browser, Opera, UC Browser, or other mobile browsers when they appear in customer analytics, regional usage data, contractual requirements, or the product’s support policy.

Tablet Browser Market Share
Statscounter.com graph for browser usage on tablets
Source: Statscounter.com

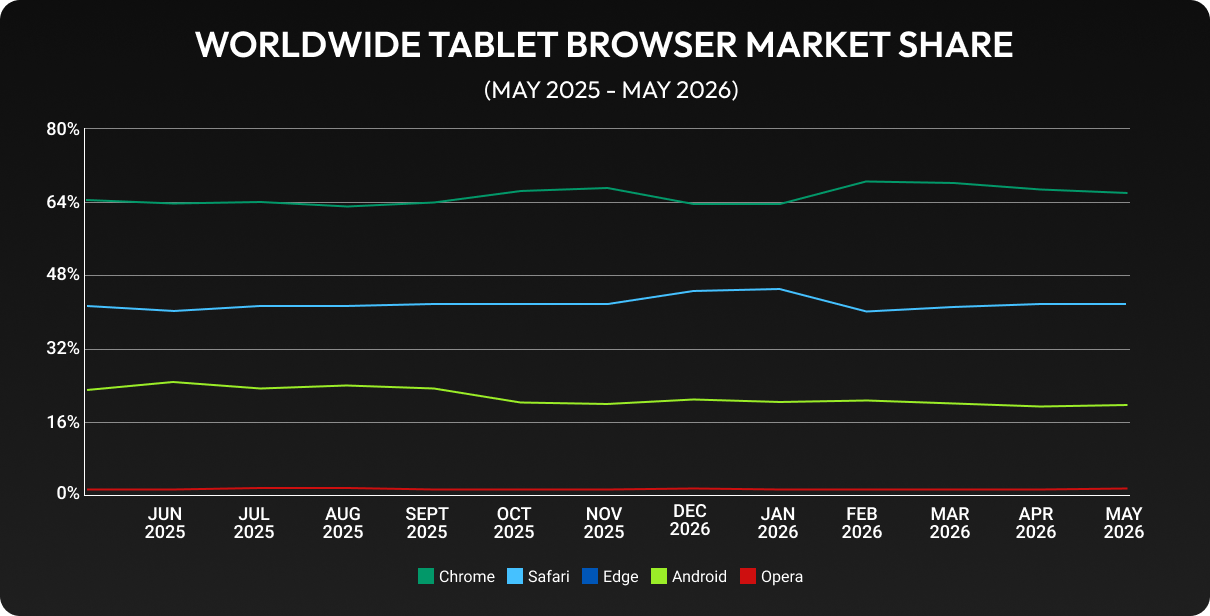
Tablet usage is less concentrated than desktop or mobile browsing. Chrome led with 49.49% in May 2026, followed by Safari at 31.33% and the category labeled Android Browser at 14.77%. Samsung Browser held 1.53%, while Opera and Edge each accounted for approximately 1%.

Chrome gained 1.21 percentage points from May 2025, while Safari rose 0.26 points. Android Browser fell 2.38 points.

Key Takeaways

  • Chrome leads tablet browsing without holding a majority. Its share increased from 48.28% to 49.49%, making Chrome on Android tablets a major testing priority. Tablet coverage should account for layouts and interactions that differ from desktops and phones.
  • Safari holds nearly one-third of tablet usage. Its share remained stable, moving from 31.07% to 31.33%. The iPad may carry even greater weight for applications used in education, healthcare, retail, hospitality, media, and field work.
  • Android Browser remains unusually prominent in the tablet dataset. Its 14.77% share is far higher than its mobile or overall share, despite falling from 17.15% a year earlier. Teams should compare the category with their own browser and device analytics before deciding how much separate coverage it requires.
  • Samsung Browser is not new to tablets. Its late appearance in StatCounter’s tablet data does not represent a new tablet launch. Add dedicated coverage when Samsung tablets appear in customer analytics, supported-device requirements, or customer accounts.

Tablet Testing Recommendations

  • Primary browser coverage: Test Safari on iPads and Chrome on representative Android tablets when tablets account for meaningful product usage.
  • Platform-specific considerations: Validate portrait and landscape layouts, touch and gesture behavior, virtual keyboards, multitasking, files, cameras, media, permissions, and larger touch-screen breakpoints.
  • When to expand coverage: Add Samsung Browser, Android Browser, older tablet operating systems, or more device models when analytics, product design, or industry use cases justify broader testing.

Browser Testing Priorities for 2026

Recommended Browser Coverage

No single browser list fits every product, but the 2026 data supports a practical baseline for organizations serving a broad worldwide audience. Teams should adjust each browser’s priority based on customer analytics, geography, contractual requirements, and product risk.

Essential priority

  • Chrome: Full coverage across Windows, macOS, and representative Android devices. Chrome carries the largest audience across every device category in the supplied data.
  • Safari: Full coverage on iPhone and iPad. Add macOS when desktop traffic, customer commitments, or support requirements include Mac users.

High priority

  • Microsoft Edge: Strong Windows coverage, especially for enterprise software, internal tools, B2B platforms, Microsoft identity integrations, and managed corporate devices.
  • Mozilla Firefox: Critical-path and regression coverage to include Gecko in the test plan. Teams should expand Firefox coverage when product analytics show usage above the worldwide average.
  • Samsung Browser: High priority for consumer products with recurring Samsung-device traffic or explicit Samsung support requirements. Otherwise, keep it as a secondary environment. 

Medium priority

  • Opera: Targeted testing only where regional traffic, customer accounts, or support commitments justify it.
  • Brave: Critical-path testing for products whose audiences include a measurable number of Brave users.
  • Older Browser Versions and Legacy Environments: Test earlier releases still covered by the product’s support policy and discontinued browsers still used by customers or older devices. If analytics report traffic from older browsers such as Android Browser, identify the affected devices and customers before assigning dedicated coverage. 

Low or targeted priority

  • UC Browser, Yandex Browser, 360 Safe Browser, QQ Browser, and other smaller browsers: Basic access or critical-path testing when regional usage, contractual support, or customer data provides a clear reason.

Teams with limited resources should begin with full regression testing in Chrome and Safari, followed by critical-path testing in Edge and Firefox. Add Samsung Browser when customer analytics, regional usage, or support commitments show a clear need. This approach reaches the largest browser populations while covering Blink, WebKit, and Gecko. 

Expanded browser coverage becomes more valuable when a product serves international markets, regulated industries, public services, high-value enterprise accounts, older devices, or workflows where a compatibility failure could block access, revenue, or essential services.

Why Cross-Browser Testing Still Matters

Modern browsers implement many of the same web standards, but they do not implement every feature at the same time or handle every edge case identically. A page that looks correct in Chrome can still behave differently in Safari, Firefox, or even another Chromium browser because browsers follow different release schedules and combine their engines with different security controls and platform integrations.

Those differences may affect a small visual detail, or they may prevent someone from completing a purchase, signing in, submitting a form, or using an essential feature. Cross-browser testing gives teams a way to find those failures before customers encounter them.

Browser Differences Continue to Exist

The largest compatibility gaps often come from the technologies browsers use to render pages and execute code. Chromium browsers use Blink, Safari uses WebKit, and Firefox uses Gecko.

Browser engines. Blink, WebKit, and Gecko process HTML and CSS, calculate layouts, render graphics, and implement browser features through separate codebases. Their associated JavaScript engines also differ in how they execute and optimize scripts.

CSS and layout. Browsers may add new CSS features at different times or handle edge cases differently. Font rendering, viewport calculations, scrolling, overflow, animation, flexbox, grid, and responsive breakpoints can all produce inconsistencies across browsers and operating systems.

JavaScript and Web APIs. Most modern JavaScript works consistently across current browsers, but API availability and implementation timing still vary. Differences can affect event handling, storage, permissions, authentication, media, notifications, clipboard access, file handling, and other browser-dependent functions.

Performance. Browsers differ in how they manage memory, execute scripts, render complex layouts, and handle background activity. A feature that performs smoothly in one environment may slow down or become unstable in another, particularly on older or lower-powered devices.

Accessibility. Keyboard focus, native controls, semantic HTML, ARIA support, error messages, and screen-reader output can vary across combinations of browser, operating system, and assistive technology. W3C's ARIA-AT project publishes support tables that score each screen reader and browser pairing separately, testing JAWS, NVDA, and VoiceOver against specific browsers rather than reporting a single support figure. 

Common Issues Found During Browser Testing

  • CSS rendering inconsistencies: Unexpected spacing, incorrect positioning, font changes, broken animations, and differences in grid or flexbox layouts.
  • Responsive layout issues: Incorrect breakpoints, horizontal scrolling, clipped content, viewport-sizing problems, and layouts that fail after an orientation change.
  • Form validation differences: Inconsistent native error messages, autofill behavior, date inputs, required fields, password controls, and virtual-keyboard behavior.
  • JavaScript compatibility bugs: Unsupported APIs, event-handling differences, timing problems, runtime errors, and functions that depend on browser-specific implementations.
  • Browser and platform functionality: Problems involving permissions, downloads, media playback, storage, authentication, notifications, cameras, microphones, and file access.
  • Performance bottlenecks: Slow page rendering, delayed interactions, excessive memory use, animation stutter, and degraded performance on lower-powered devices.

Cross-browser testing does not require a pixel-for-pixel match in every environment. The priority is confirming that critical workflows remain functional, accessible, and visually coherent across the browsers and devices customers use.

How to Choose Which Browsers to Test

Worldwide market share provides the baseline for browser coverage. It identifies the environments used by the largest audiences and gives teams a practical place to begin. From there, product analytics, customer requirements, geography, device mix, technical dependencies, contractual commitments, and release risk help determine how deeply each environment should be tested.

A browser with a small global share may account for a meaningful portion of a company’s customers. A market leader may require less coverage for an internal application used only on managed devices. These factors refine the baseline rather than replace it, helping teams decide which browsers need full regression coverage and which can receive lighter or targeted testing.

Use Your Analytics

Once a site or application has enough traffic to produce useful data, analytics can show how its audience differs from the worldwide market. Browser, operating-system, device-type, version, country, and screen-size reports reveal the environments customers already use and may identify combinations that broad rankings do not capture.

Teams should review this information regularly. Usage changes as customers replace devices, operating systems reach the end of support, browser versions update, and products enter new markets.

Analytics can also reveal more than traffic share. Error rates, conversion, page performance, abandoned workflows, support requests, and feature usage may show that customers on one browser encounter more problems than others. A browser with limited traffic may warrant deeper testing when its users experience a disproportionate number of failures.

Consider Your Industry

Different industries attract different users and face different consequences when browser compatibility fails.

SaaS applications. B2B software may see heavy use on Windows, Chrome, and Edge, particularly within managed corporate environments. Mac and Safari coverage may increase for products serving technology, design, or media teams. Authentication, dashboards, file handling, integrations, and long-running sessions often deserve special attention.

Ecommerce websites. Retailers need broad mobile coverage because checkout failures directly affect revenue. Chrome on Android and Safari on iPhone need extensive testing, along with payment methods, autofill, address forms, promotional codes, product media, and third-party checkout services.

Government websites. Public services may require wider coverage because users often have limited control over their devices or software. Accessibility requirements, older hardware, public computers, multilingual content, forms, and document downloads may justify testing beyond the most popular browsers.

Healthcare applications. Patient portals and clinical systems may need to support both consumer mobile devices and controlled enterprise environments. Privacy, authentication, forms, scheduling, document access, accessibility, and compatibility with managed hospital systems can influence browser priorities.

Enterprise software. Internal applications frequently run on standardized Windows devices, making Edge and Chrome especially important. Enterprise policies, identity providers, security software, extensions, older browser versions, and legacy systems may also affect the test plan.

Industry provides context for the initial plan, while product and customer evidence determine how coverage should be adjusted. Two products in the same sector can still serve very different browser populations.

Consider Geographic Audience

Worldwide figures can hide major regional differences. A browser with a small global share may be far more common in a particular country, while device costs, network conditions, local software, and customer preferences can change the browser mix.

International products should review browser and device usage by country rather than applying one worldwide plan everywhere. Regional testing may also need to account for:

  • lower-powered devices
  • older operating-system versions
  • slower or less reliable networks
  • local payment services
  • language and script requirements
  • data-saving browser features
  • regional privacy or security settings

Geographic expansion should trigger a browser-coverage review. A plan designed for a primarily U.S. audience may leave substantial gaps when the product enters markets with different devices, networks, and browser preferences.

Consider Device Mix

Browser names alone do not define the testing environment. Chrome on a Windows laptop, an Android phone, and a tablet involves different hardware, operating systems, input methods, viewport sizes, and platform controls.

Desktop-first applications should emphasize keyboard navigation, mouse interactions, resizable windows, complex layouts, file uploads, downloads, multiple tabs, and enterprise integrations. Chrome and Edge on Windows often lead the plan, with Safari on macOS and Firefox added according to audience, support requirements, and compatibility risk.

Mobile-first applications need stronger testing across physical Android and iPhone devices. Touch input, virtual keyboards, orientation changes, permissions, authentication, media capture, responsive navigation, network conditions, and device performance all affect the experience.

Cross-platform products should test the same critical workflows across desktop, mobile, and tablet environments. Teams should also validate transitions between devices when customers begin a task on one platform and complete it on another.

Device mix can vary by feature. A product may receive most of its traffic from phones while complex account management happens primarily on desktop computers. Feature-level analytics can help teams assign testing depth more precisely than a single sitewide percentage.

Build Coverage Around Risk

Market share identifies reach, while risk determines testing depth. A browser used by 2% of customers may deserve more attention than one used by 10% when the smaller group includes major accounts or depends on a critical financial, healthcare, public-service, or revenue-generating workflow.

Teams should weigh:

  • customer usage
  • business value
  • workflow criticality
  • rendering-engine coverage
  • accessibility requirements
  • contractual commitments
  • regulatory obligations
  • defect history
  • cost of failure

A browser that scores high on even two or three of these belongs in the plan regardless of its market share. 

Build a Browser Testing Strategy That Fits Your Users

Chrome remains the dominant browser across desktop, mobile, and tablet traffic in 2026. Safari remains essential for Apple devices, Edge has added importance in Windows and enterprise environments, and Firefox and Samsung Browser can warrant broader coverage based on a product’s audience.

Market share provides the baseline, while customer analytics determine how that baseline should be refined. Teams should review their browser strategy at least annually as usage patterns, operating systems, devices, supported versions, and customer markets change.

Your browser coverage should reflect the browsers, devices, and workflows your customers use today. PLUS QA’s U.S.-based team tests websites and web applications across 800+ real devices and can develop a browser testing strategy tailored to your users, technology, and business goals. Contact PLUS QA  to assess your current coverage and prepare for your next release.

CONTACT US